College Football Preseason Rankings 2020: Clemson and Alabama Favorites Again
August 27, 2020 – by Jason Lisk
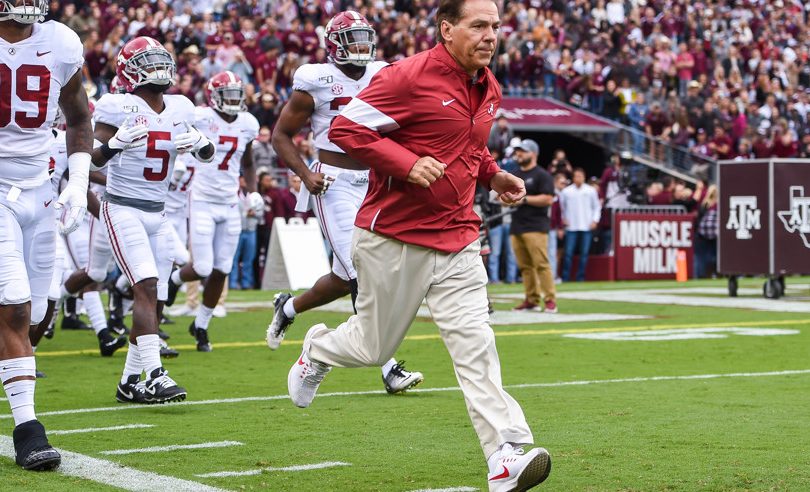
Nick Saban leads the charge into yet another college football season (Photo by Daniel Dunn/Icon Sportswire)
2020 has been unlike any year we have experienced. In college football, we have a season about to begin where over one-third of the teams will not be participating this fall. Among those who are playing there have sometimes been massive shifts in scheduling and alignment. Notre Dame, for example, is playing a full ACC schedule this year and is eligible to win the conference title. With the Mountain West cancelled, Air Force is playing just two games: against Army and Navy.
There is one familiar constant in this sea of change, though. Clemson and Alabama, again, sit atop the preseason rankings. The two have met in three of the last five championship games. Last year, LSU disrupted the Alabama-Clemson party with a huge year from QB Joe Burrow and the offense. Burrow is on to the NFL, though, as is a lot of talent off that LSU team. That means, at the outset, Clemson and Alabama look like the favorites.
Below are the official TeamRankings 2020 college football preseason rankings and predictive ratings.
If you’d like to learn about the methodology behind our mostly data-driven preseason team ratings, make sure your read our post on How We Make College Football Preseason Rankings.
If you just want to see the 2020 rankings, keep reading to find out how good (or bad) we expect the 77 FBS teams competing this fall to be, starting with the TR Top 25.
NFL Week 1 Picks
Content:
ToggleBetting – Survivor – Pick’em
Start Free TrialGet The Season
The 2020 TeamRankings College Football Preseason Top 25
Jump to rankings for all FBS teams playing in the fall
The table below presents our 25 highest ranked teams in the preseason (e.g. Clemson at No. 1), along with their associated preseason predictive ratings (e.g. 29.3 for Clemson).
The final five columns of the table show the relative contribution that specific predictive factors and our “market adjustment” made to our final preseason rating for each team. We’ll explain those more below.
| TR Rank | Team | 2020 Rating | LAST YEAR | PROGRAM | RETURNING | LUCK | MARKET |
|---|---|---|---|---|---|---|---|
| 1 | Clemson | 29.3 | 23.3 | 5.8 | 2.5 | -1.3 | -1.0 |
| 2 | Alabama | 27.1 | 21.5 | 6.7 | -3.3 | -0.8 | 3.0 |
| 3 | Georgia | 21.8 | 16.6 | 2.9 | -2.1 | -0.5 | 5.0 |
| 4 | Oklahoma | 19.9 | 13.2 | 4.5 | -3.5 | 1.8 | 4.0 |
| 5 | Louisiana State | 18.8 | 24.4 | 3.3 | -9.8 | -2.2 | 3.0 |
| 6 | Notre Dame | 17.8 | 14.6 | 2.7 | -2.3 | -0.3 | 3.0 |
| 7 | Texas A&M | 16.8 | 8.8 | 2.0 | 3.5 | 0.5 | 2.0 |
| 8 | Florida | 16.4 | 14.9 | 1.6 | -0.3 | -0.8 | 1.0 |
| 9 | Auburn | 15.6 | 15.6 | 4.0 | 2.1 | -1.2 | -5.0 |
| 10 | Texas | 15.1 | 9.4 | 1.6 | 2.0 | 0.1 | 2.0 |
| 11 | Central Florida | 13.5 | 10.3 | 1.9 | 3.5 | -0.2 | -2.0 |
| 12 | Oklahoma State | 13.4 | 6.0 | 3.1 | 5.5 | 0.9 | -2.0 |
| 13 | North Carolina | 10.2 | 6.7 | 0.4 | 4.6 | -1.5 | 0.0 |
| 14 | Iowa State | 9.8 | 7.2 | 1.0 | -0.1 | 0.7 | 1.0 |
| 15 | Baylor | 9.1 | 10.8 | 0.0 | -1.9 | -1.8 | 2.0 |
| 16 | Kentucky | 8.6 | 4.9 | 0.3 | 2.8 | -0.3 | 1.0 |
| 17 | Tennessee | 8.3 | 3.4 | 0.5 | 2.0 | 1.4 | 1.0 |
| 18 | Virginia Tech | 8.2 | 2.1 | 2.6 | 1.6 | -0.1 | 2.0 |
| 19 | Appalachian State | 7.9 | 7.2 | 0.8 | 3.7 | -0.7 | -3.0 |
| 20 | Miami | 7.7 | 1.8 | 3.0 | -3.9 | -0.3 | 7.0 |
| 21 | Memphis | 7.2 | 9.4 | 1.6 | -0.5 | 0.8 | -4.0 |
| 22 | Texas Christian | 7.0 | 4.8 | 2.0 | 0.6 | 0.7 | -1.0 |
| 23 | Cincinnati | 6.8 | 6.9 | -2.0 | 1.8 | -1.0 | 1.0 |
| 24 | Louisville | 6.5 | 1.3 | 2.6 | 3.4 | 0.2 | -1.0 |
| 25 | Navy | 6.1 | 8.7 | 0.6 | -1.2 | -2.0 | 0.0 |
2020 Preseason Ratings Predictive Factors
We’ve done a lot of research over the years to identify and value team-level stats that are highly correlated with success in the upcoming college football season.
Just as importantly, we’ve worked to identify and ignore information that seems like it should help determine how good a team is going to be, but actually doesn’t hold up to rigorous, historical data based testing.
While we encourage you to read our full preseason rankings methodology, here’s a quick explanation of the factors we currently use in our preseason ratings:
LAST YEAR: How good a team was last yearPROGRAM: How consistently good a team has been in recent history (excluding last year)RETURN: A measure of how much performance in key stat areas last year came from players returning this yearLUCK: A measure of how likely a team is to improve in higher-variance metrics like turnoversMARKET: An adjustment made if our initial projection is far off the AP Poll and/or betting market
In a college football or NFL pick’em pool?Get an edge with our Football Pick’em Picks
The Relative Importance Of Rankings Factors
You can see from the relative values in the table above that certain predictive factors are worth more than others. For example, how a team did last season (LAST YEAR) tends to be a very good predictor of how it will do this season.
In comparison, how a team has done over a longer period of recent history (PROGRAM) — more a measure of its success at perennially restocking talent and developing players — also has a predictive impact, but the correlation with upcoming season performance generally isn’t as strong as LAST YEAR.
MARKET, the lone subjective factor of the bunch, can vary widely from team to team. It is an adjustment we make based on team-specific factors that likely represent blind spots in our current preseason ratings algorithm. It deserves an appropriate explanation, which you can also find in our preseason rankings explanation post.
College Football Preseason Rankings Highlights
As with several other recent years, our 2020 preseason ratings have a clear top two teams that are well ahead of the field. Clemson and Alabama’s perceived dominance is further increased by Ohio State no longer being part of the ratings this fall, with the Big Ten season cancelled.People tend to fixate on rankings, but looking at ratings is more important. Yes, Georgia ranks No. 3, but the difference between the Bulldogs and the two top contenders is over 5 points on a neutral field. That’s about the same difference between Georgia and No. 8 Florida.You may wonder why we have the defending national champion LSU Tigers down at 5th. The Returning Player adjustment is at -9.8, by far the highest of any team in the Top 25, and second-highest of any of the 77 teams playing this fall. Only Florida Atlantic has a bigger negative adjustment for starters/talent lost.You also might be interested in knowing how the absence of teams from the Big Ten, Pac-12, and others has affected where teams fall in the rankings. After all, the standard for getting in the Top 25 is lower with fewer competing teams. This year’s 10th-ranked team (Texas) would have been tied for 15th in last year’s preseason ratings, while No. 25 Navy (+6.1) would have been tied for 44th.For the second year in a row, Oklahoma has our biggest luck adjustment upward. That means last year’s results could have been a little better with just average luck in areas such as turnovers. At the other end of the spectrum, Baylor and Navy got the biggest luck adjustments downward among the Top 25. (You can now sort by each column header to see where teams rank in various categories that went into our rankings.)Last year, Nebraska and Texas got our two biggest market adjustments upward. That is, the market was far more optimistic than our underlying predictive inputs, so we regressed to the market. Both of those teams wildly disappointed public expectations a year ago. This year, Miami and Wake Forest of the ACC have the biggest upward market adjustments. Miami is more similar to Nebraska and Texas, as a bigger name program with a relatively new coach. (Manny Diaz is entering Year 2 with Miami.) Wake Forest does not have those things, and it’s not super clear to us why the market is far more optimistic about them.
2020 TeamRankings College Football Preseason Rankings (All Teams)
| TR Rank | Team | 2020 Rating | LAST YEAR | PROGRAM | RETURNING | LUCK | MARKET |
|---|---|---|---|---|---|---|---|
| 1 | Clemson | 29.3 | 23.3 | 5.8 | 2.5 | -1.3 | -1.0 |
| 2 | Alabama | 27.1 | 21.5 | 6.7 | -3.3 | -0.8 | 3.0 |
| 3 | Georgia | 21.8 | 16.6 | 2.9 | -2.1 | -0.5 | 5.0 |
| 4 | Oklahoma | 19.9 | 13.2 | 4.5 | -3.5 | 1.8 | 4.0 |
| 5 | Louisiana State | 18.8 | 24.4 | 3.3 | -9.8 | -2.2 | 3.0 |
| 6 | Notre Dame | 17.8 | 14.6 | 2.7 | -2.3 | -0.3 | 3.0 |
| 7 | Texas A&M | 16.8 | 8.8 | 2.0 | 3.5 | 0.5 | 2.0 |
| 8 | Florida | 16.4 | 14.9 | 1.6 | -0.3 | -0.8 | 1.0 |
| 9 | Auburn | 15.6 | 15.6 | 4.0 | 2.1 | -1.2 | -5.0 |
| 10 | Texas | 15.1 | 9.4 | 1.6 | 2.0 | 0.1 | 2.0 |
| 11 | Central Florida | 13.5 | 10.3 | 1.9 | 3.5 | -0.2 | -2.0 |
| 12 | Oklahoma State | 13.4 | 6.0 | 3.1 | 5.5 | 0.9 | -2.0 |
| 13 | North Carolina | 10.2 | 6.7 | 0.4 | 4.6 | -1.5 | 0.0 |
| 14 | Iowa State | 9.8 | 7.2 | 1.0 | -0.1 | 0.7 | 1.0 |
| 15 | Baylor | 9.1 | 10.8 | 0.0 | -1.9 | -1.8 | 2.0 |
| 16 | Kentucky | 8.6 | 4.9 | 0.3 | 2.8 | -0.3 | 1.0 |
| 17 | Tennessee | 8.3 | 3.4 | 0.5 | 2.0 | 1.4 | 1.0 |
| 18 | Virginia Tech | 8.2 | 2.1 | 2.6 | 1.6 | -0.1 | 2.0 |
| 19 | Appalachian State | 7.9 | 7.2 | 0.8 | 3.7 | -0.7 | -3.0 |
| 20 | Miami | 7.7 | 1.8 | 3.0 | -3.9 | -0.3 | 7.0 |
| 21 | Memphis | 7.2 | 9.4 | 1.6 | -0.5 | 0.8 | -4.0 |
| 22 | Texas Christian | 7.0 | 4.8 | 2.0 | 0.6 | 0.7 | -1.0 |
| 23 | Cincinnati | 6.8 | 6.9 | -2.0 | 1.8 | -1.0 | 1.0 |
| 24 | Louisville | 6.5 | 1.3 | 2.6 | 3.4 | 0.2 | -1.0 |
| 25 | Navy | 6.1 | 8.7 | 0.6 | -1.2 | -2.0 | 0.0 |
| 26 | Kansas State | 5.7 | 6.1 | 1.8 | 0.3 | 1.5 | -4.0 |
| 27 | Wake Forest | 5.4 | 1.0 | 0.9 | -2.4 | -1.1 | 7.0 |
| 28 | Florida State | 4.9 | 1.1 | 2.5 | 0.5 | 0.8 | 0.0 |
| 29 | Mississippi | 4.8 | 3.2 | 0.4 | 1.5 | 0.7 | -1.0 |
| 30 | Air Force | 4.0 | 6.2 | -0.4 | 0.7 | -0.4 | -2.0 |
| 31 | Virginia | 3.6 | 4.2 | -1.0 | -3.8 | 0.3 | 4.0 |
| 32 | Houston | 3.4 | -1.2 | 1.0 | 5.1 | 1.4 | -3.0 |
| 33 | South Carolina | 3.3 | 3.4 | 0.1 | -1.2 | 0.0 | 1.0 |
| 34 | Pittsburgh | 2.7 | -0.9 | 1.1 | 0.2 | 0.3 | 2.0 |
| 35 | UL Lafayette | 2.6 | 6.7 | -3.2 | 1.8 | -1.8 | -1.0 |
| 36 | Mississippi State | 2.6 | 3.2 | 1.6 | -2.9 | -0.3 | 1.0 |
| 37 | West Virginia | 2.2 | -3.4 | 1.9 | 1.5 | 0.2 | 2.0 |
| 38 | Tulane | 1.8 | 3.5 | -1.4 | -2.6 | 0.3 | 2.0 |
| 39 | Tulsa | 1.7 | -0.9 | -0.1 | 3.1 | -0.3 | 0.0 |
| 40 | Southern Methodist | 1.7 | 4.5 | -1.4 | -2.1 | -0.4 | 1.0 |
| 41 | Texas Tech | 1.4 | 0.1 | 0.8 | -0.5 | -0.1 | 1.0 |
| 42 | Boston College | 1.2 | -2.1 | 0.3 | 1.4 | 0.7 | 1.0 |
| 43 | Missouri | 1.0 | 3.7 | 0.7 | -1.3 | -0.2 | -2.0 |
| 44 | Duke | 0.9 | -1.7 | 0.6 | -0.6 | 0.6 | 2.0 |
| 45 | UAB | -0.5 | -7.4 | -2.4 | 4.3 | 0.0 | 5.0 |
| 46 | Brigham Young | -0.7 | -0.7 | 0.0 | 0.3 | -0.3 | 0.0 |
| 47 | NC State | -1.9 | -7.7 | 1.8 | 2.5 | 0.4 | 1.0 |
| 48 | Syracuse | -2.8 | -3.0 | -0.6 | -3.3 | 1.0 | 3.0 |
| 49 | Western Kentucky | -3.0 | -2.2 | -0.2 | -1.0 | 0.4 | 0.0 |
| 50 | Georgia Southern | -3.6 | -3.7 | -2.2 | 1.5 | 0.8 | 0.0 |
| 51 | Army | -3.8 | -3.8 | 0.1 | -0.5 | 0.3 | 0.0 |
| 52 | Georgia Tech | -4.0 | -9.4 | 1.2 | 5.5 | -0.2 | -1.0 |
| 53 | Southern Miss | -4.2 | -4.2 | -1.5 | 0.6 | 0.9 | 0.0 |
| 54 | Temple | -4.6 | -2.6 | 0.6 | -0.6 | -1.0 | -1.0 |
| 55 | South Florida | -4.6 | -6.9 | 1.0 | 2.5 | -1.3 | 0.0 |
| 56 | Arkansas | -4.7 | -7.4 | -0.3 | -0.5 | 1.3 | 2.0 |
| 57 | Kansas | -6.2 | -7.3 | -3.2 | -1.4 | 0.6 | 5.0 |
| 58 | Florida Atlantic | -6.7 | 5.5 | -2.0 | -10.3 | -3.9 | 4.0 |
| 59 | Troy | -7.2 | -8.0 | 0.2 | 0.2 | 0.4 | 0.0 |
| 60 | Louisiana Tech | -8.1 | -2.7 | -0.3 | -2.6 | -2.5 | 0.0 |
| 61 | Coastal Carolina | -8.4 | -8.6 | -3.8 | 0.6 | 0.4 | 3.0 |
| 62 | Marshall | -8.9 | -4.2 | -2.3 | -1.9 | -0.4 | 0.0 |
| 63 | Rice | -9.0 | -10.0 | -4.8 | 4.9 | 1.0 | 0.0 |
| 64 | Georgia St. | -9.4 | -8.9 | -3.4 | 2.4 | 0.4 | 0.0 |
| 65 | Liberty | -9.5 | -6.5 | -1.6 | -5.9 | -0.5 | 5.0 |
| 66 | East Carolina | -9.9 | -10.3 | -3.3 | 3.1 | 0.6 | 0.0 |
| 67 | Arkansas St. | -9.9 | -6.0 | -0.7 | -3.6 | 0.3 | 0.0 |
| 68 | Charlotte | -9.9 | -8.5 | -4.5 | 3.1 | 0.0 | 0.0 |
| 69 | Middle Tennessee | -11.1 | -6.5 | -1.6 | 0.6 | -0.6 | -3.0 |
| 70 | UL Monroe | -11.3 | -8.4 | -3.8 | 0.2 | 0.8 | 0.0 |
| 71 | North Texas | -11.4 | -9.0 | -2.3 | -1.1 | 0.9 | 0.0 |
| 72 | Vanderbilt | -12.0 | -8.3 | -0.1 | -0.5 | -0.1 | -3.0 |
| 73 | Texas-San Antonio | -13.8 | -15.5 | -2.1 | 2.3 | 1.5 | 0.0 |
| 74 | South Alabama | -14.6 | -12.9 | -3.2 | -0.1 | 1.5 | 0.0 |
| 75 | Florida International | -14.6 | -9.0 | -3.1 | -3.4 | 0.9 | 0.0 |
| 76 | Texas State | -21.8 | -14.1 | -6.0 | -2.3 | 0.6 | 0.0 |
| 77 | Texas El Paso | -29.8 | -20.9 | -5.3 | -4.9 | 1.3 | 0.0 |
Remember, if you’re in a football pool or planning on betting some games this football season, check out our Football Pick’em Picks , NFL Survivor Picks and College Football Betting Picks.
If you liked this post, please share it. Thank you! Twitter Facebook
NFL Football Pool Picks NFL Survivor Pool Picks NCAA Bracket Picks College Bowl Pool Picks College Football Pool Picks NFL Picks NBA Picks MLB Picks College Football Picks College Basketball Picks NFL Predictions NBA Predictions MLB Predictions College Football Predictions College Basketball Predictions NFL Spread Picks NBA Spread Picks MLB Spread Picks College Football Spread Picks College Basketball Spread Picks NFL Rankings NBA Rankings MLB Rankings College Football Rankings College Basketball Rankings NFL Stats NBA Stats MLB Stats College Football Stats College Basketball Stats NFL Odds NBA Odds MLB Odds College Football Odds College Basketball Odds A product ofTeamRankings BlogAboutTeamJobsContact
© 2005-2024 Team Rankings, LLC. All Rights Reserved. Statistical data provided by Gracenote.
TeamRankings.com is not affiliated with the National Collegiate Athletic Association (NCAA®) or March Madness Athletic Association, neither of which has supplied, reviewed, approved or endorsed the material on this site. TeamRankings.com is solely responsible for this site but makes no guarantee about the accuracy or completeness of the information herein.
Terms of ServicePrivacy Policy

